
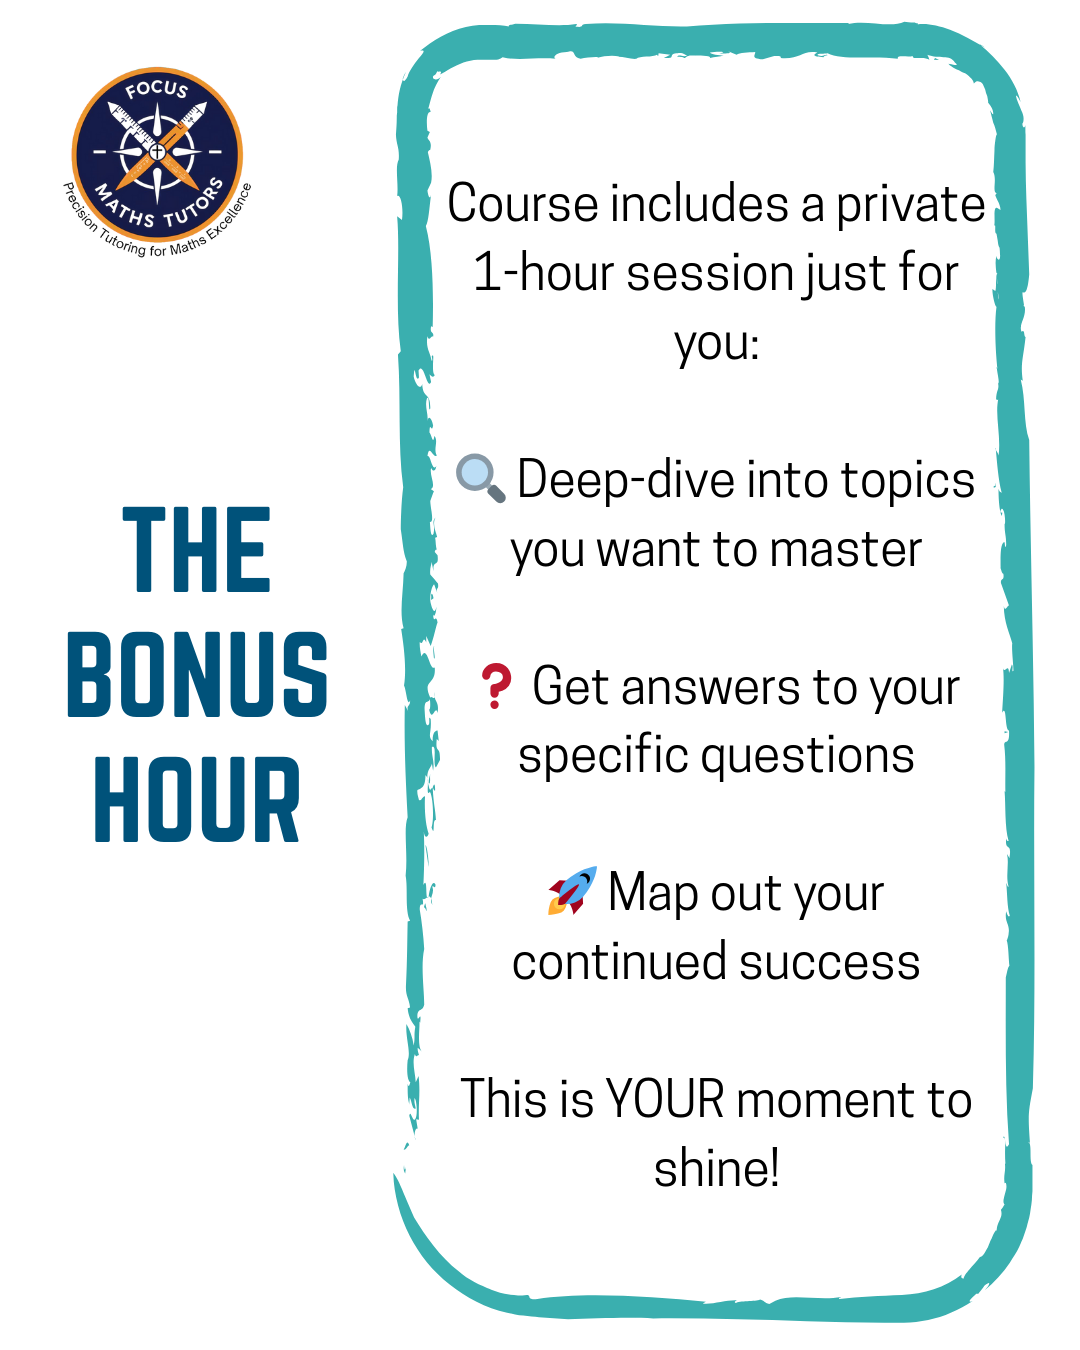
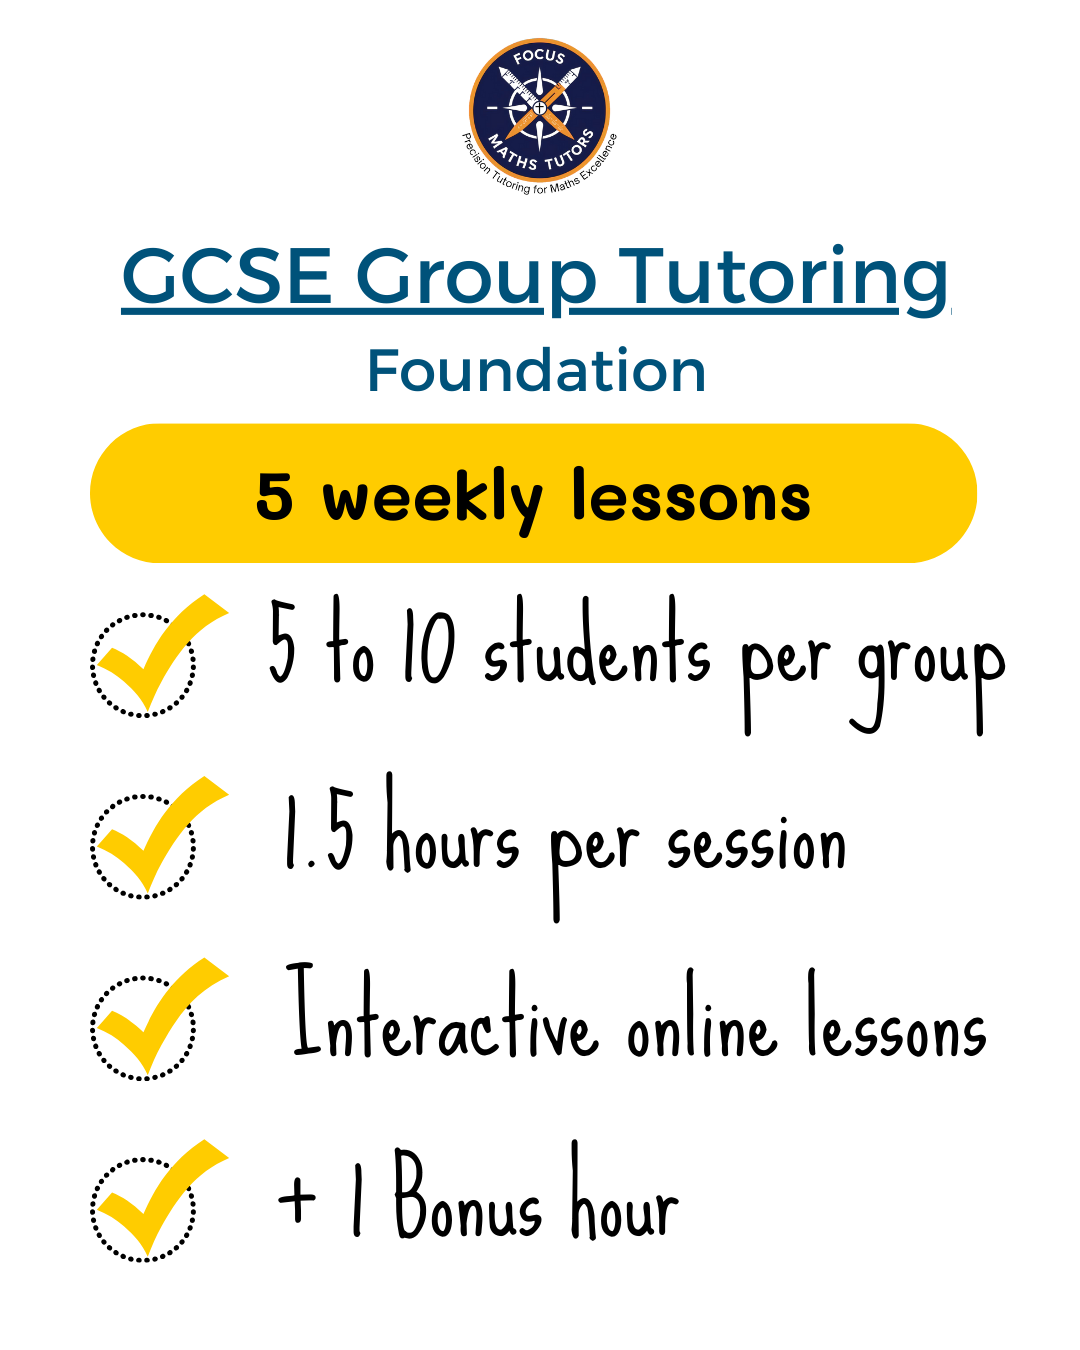
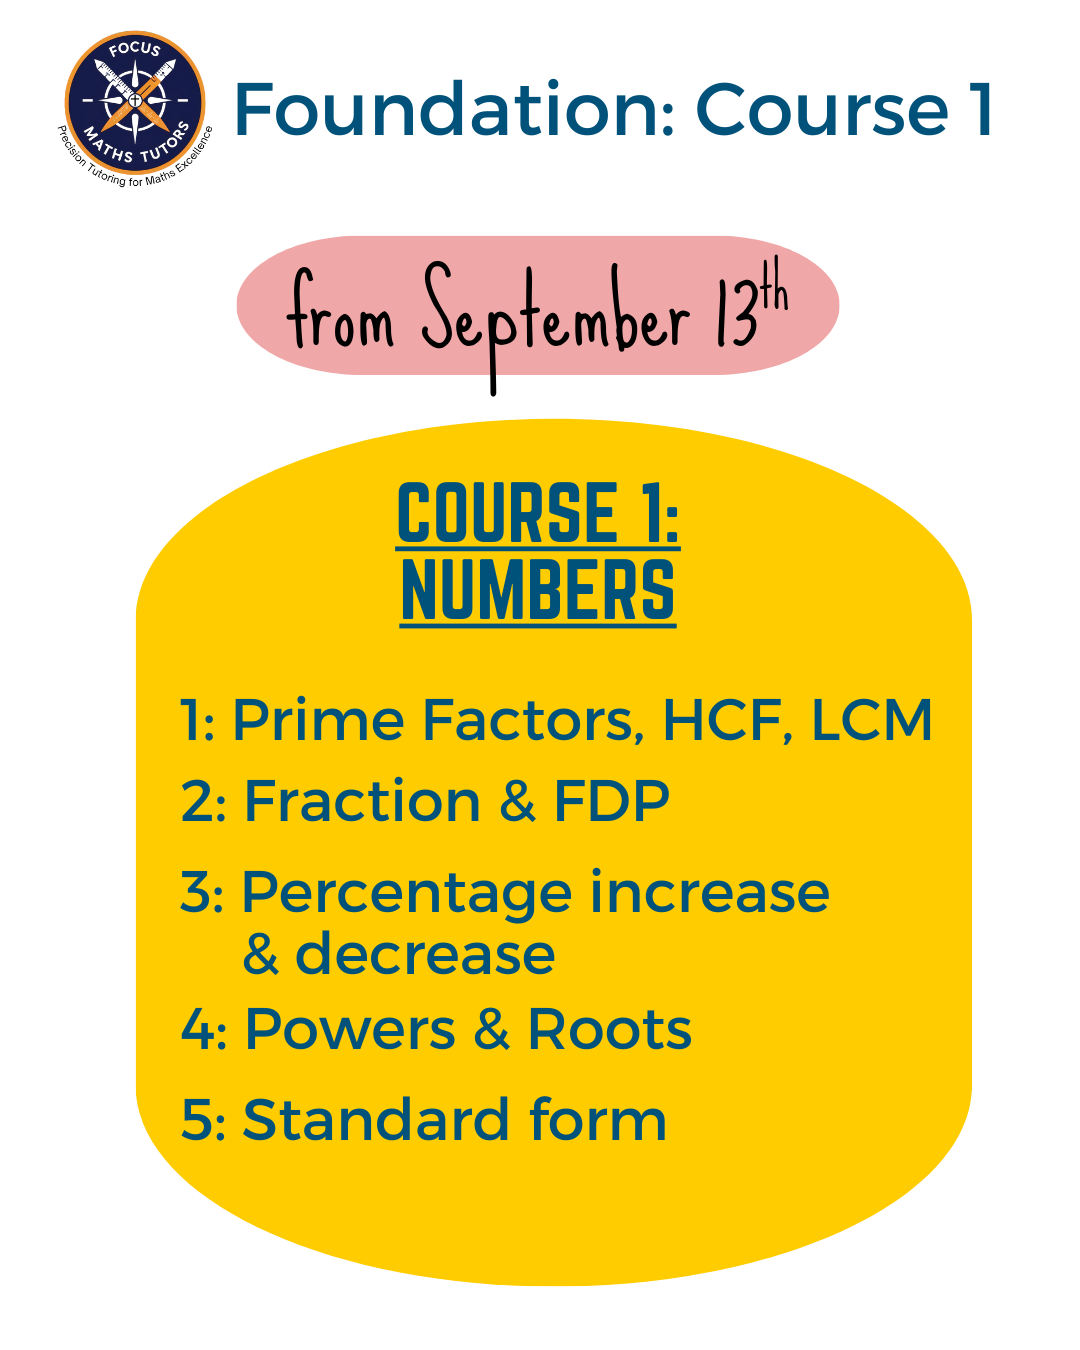
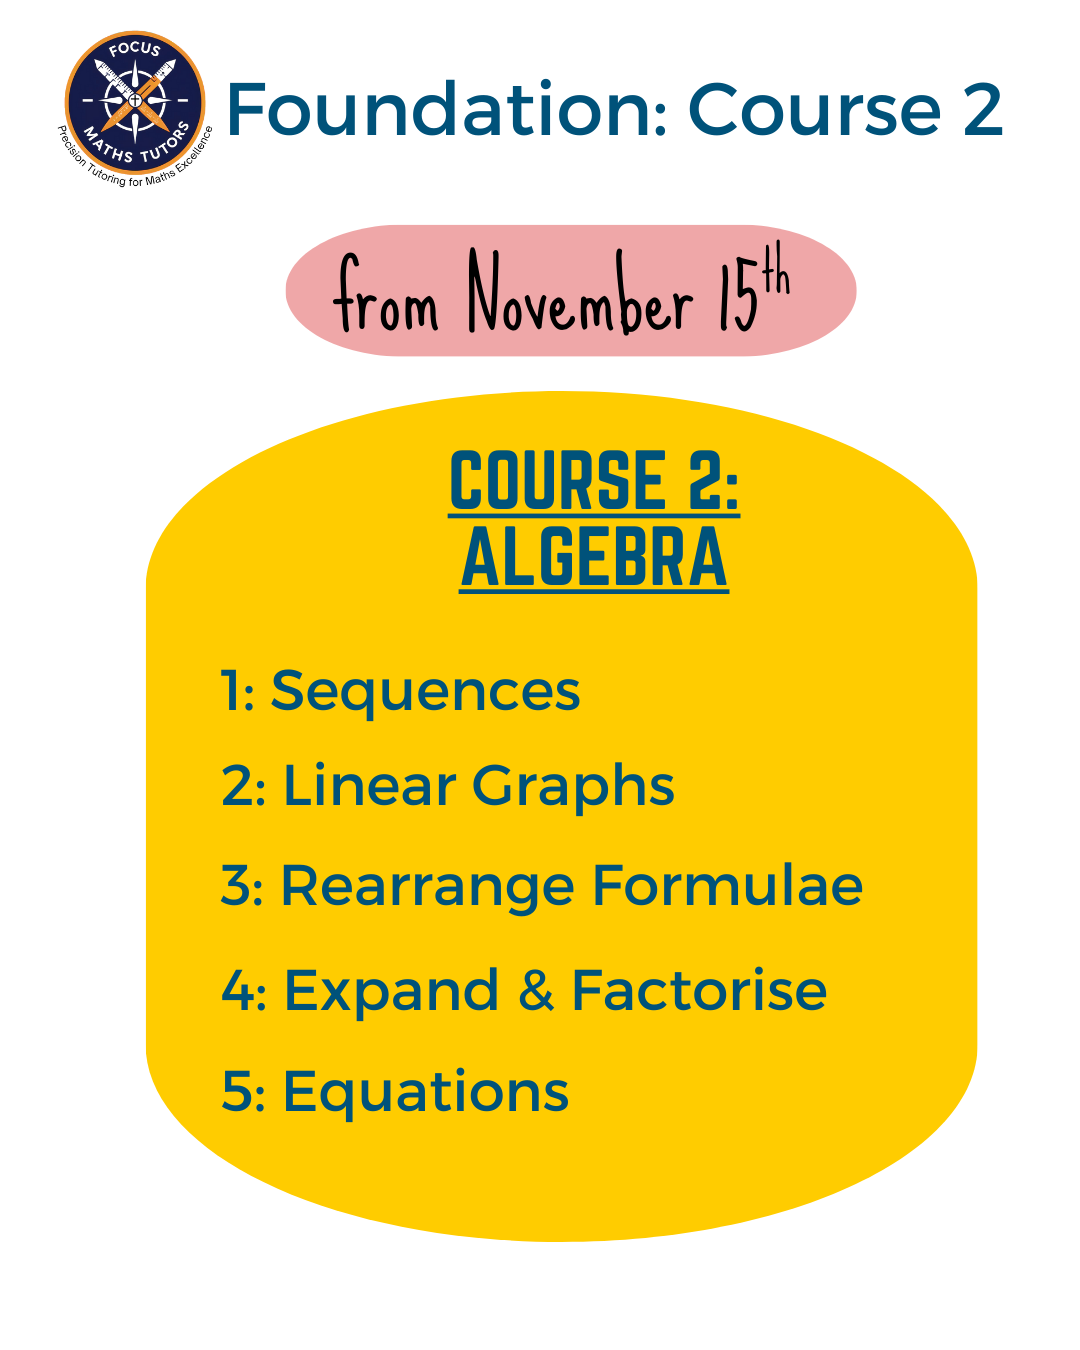
This course starts on the 24th April 2026
4. Statistics & Probability
01
Scatter Graphs
Ever wondered if more study hours really lead to better test scores?
Scatter graphs let you investigate relationships between two variables visually. Spotting correlation types and drawing best-fit lines develop critical thinking skills for distinguishing causation from coincidence.
These analytical methods prepare you for advanced statistics and foster the data literacy needed to make sense of social-media trends, scientific research and news reports.
02
Stem & Leaf Diagrams
What’s the quickest way to organise a set of test scores so you can spot patterns?
Stem and leaf diagrams preserve each data point while grouping them for easy analysis. This organised approach simplifies statistical calculations and helps compare datasets effectively.
Learning these techniques gets you ready for frequency analysis and data interpretation, building the systematic toolkit required for research projects, coursework and real-world data challenges.
03
Averages from Tables
How do pollsters work out average opinions from thousands of survey responses?
Calculating averages from frequency tables lets you handle large, organised datasets confidently. Mastering mean, median and mode in different formats builds your ability to choose the right statistical measure for any context.
These skills pave the way for statistical inference and enhance your data-analysis toolkit for GCSE maths and beyond.
04
Basic Probability
Should you choose the mystery box or accept the guaranteed prize?
Probability quantifies uncertainty, equipping you to analyse chance events from gaming strategies to weather forecasts. Learning simple probability scales and calculations helps you express likelihood accurately and make informed choices.
These fundamentals underpin advanced probability techniques and develop strategic thinking for games, sports and everyday decisions.
05
Tree Diagrams
What are the odds of rolling doubles twice in a row, or drawing two red cards consecutively?
Tree diagrams provide a clear, step-by-step method for calculating probabilities in multi-stage events. Mastering branch-multiplication and outcome-addition techniques lets you tackle compound probability problems with confidence.
These logical reasoning tools prepare you for decision analysis and sharpen your ability to model complex scenarios, from quizzes and quizzes to real-world risk assessments.

Telephone: +44 07466 980 795
E-mail: info@focusmathstutors.co.uk