
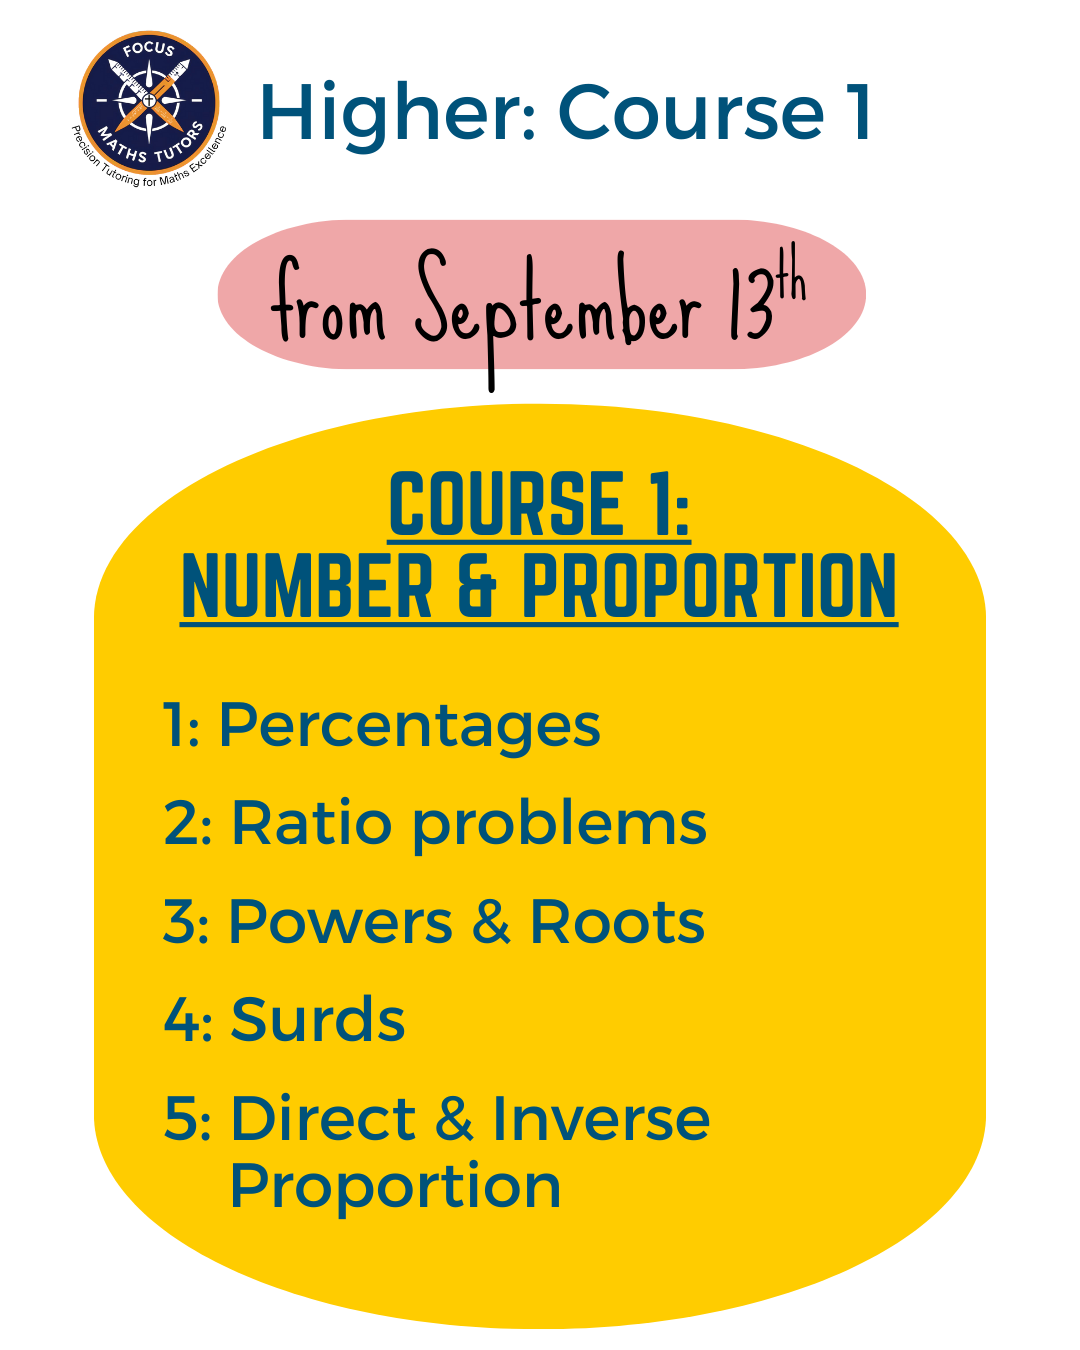
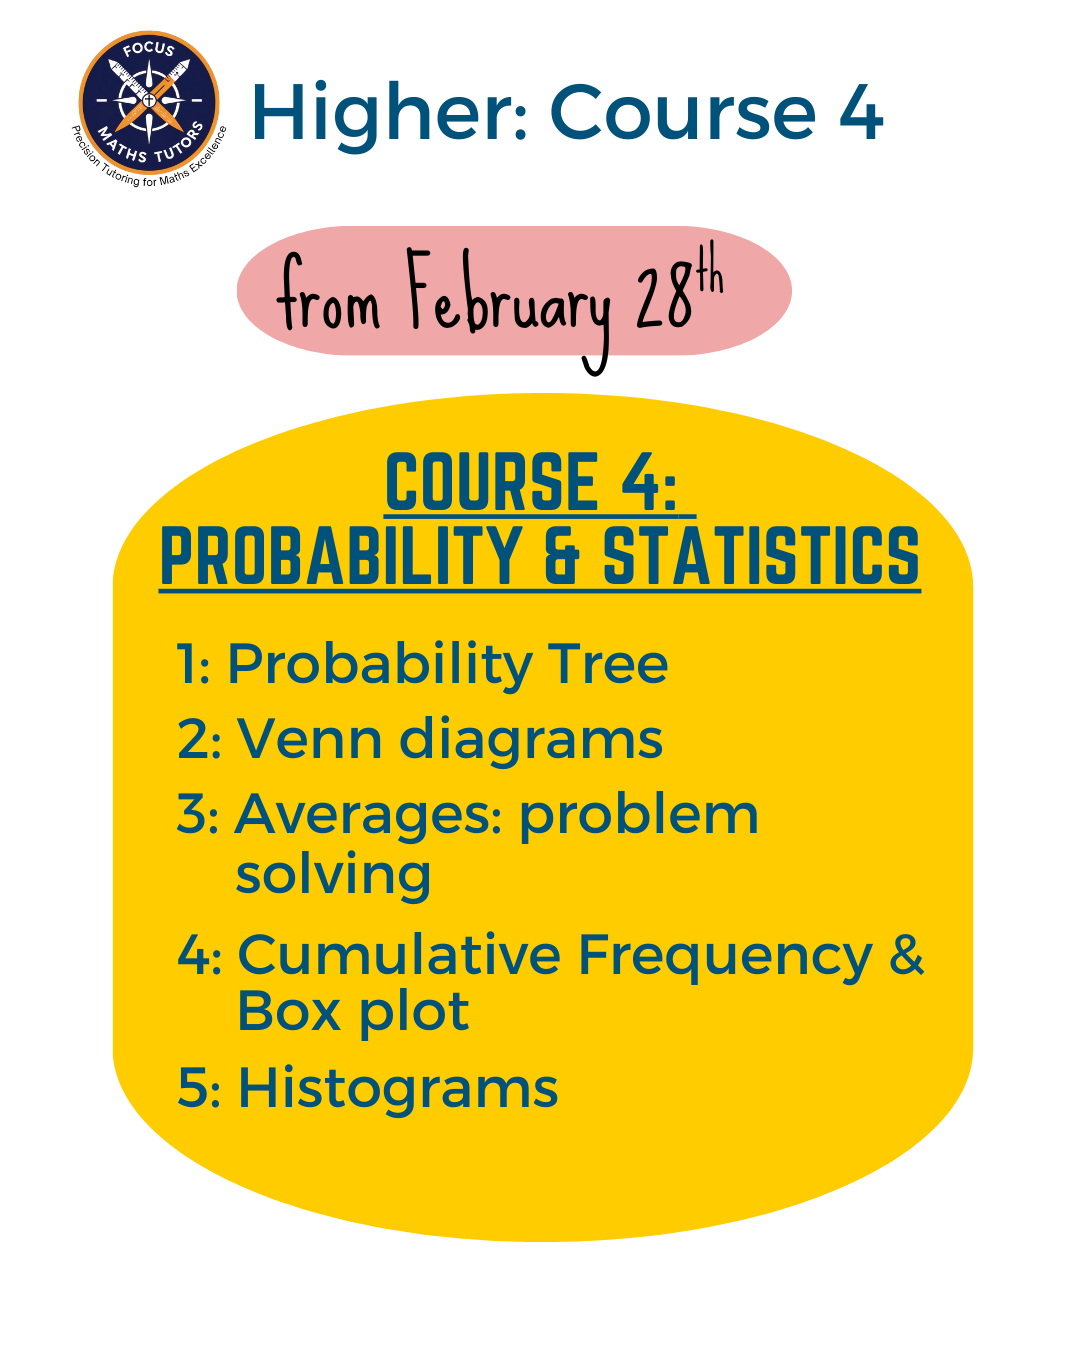
This course starts on the 28th February 2026
4. Probability & Statistics
01
Probability Tree
Probability trees provide systematic visual methods for calculating complex probabilities across multiple events and stages, forming a cornerstone skill for GCSE Higher mathematics.
Recapping frequency trees establishes foundational understanding of how data can be organised and analysed through branching structures. Learning to create and complete a tree diagram enables pupils to methodically work through sequential events, ensuring all possible outcomes are considered using the AND rule (multiply along branches) and OR rule (add separate paths).
The ability to work out the probabilities of both independent and dependent events using tree diagrams is essential for understanding real-world scenarios where outcomes influence subsequent events, such as drawing cards without replacement or medical testing sequences.
Learners must master conditional probability calculations using P(A|B) notation, handle without replacement problems where probabilities change after each selection, and tackle complex multi-stage scenarios involving three or more events. Advanced applications include solving "at least one" problems using 1 - P(none) methods, and reverse probability calculations.
02
Venn Diagram
Venn diagrams offer powerful visual tools for representing relationships between sets and calculating probabilities involving multiple conditions.
Recapping Venn diagrams and set notations reinforces understanding of mathematical language and symbolic representation used in probability and set theory, including universal set (ξ), union (∪), intersection (∩), and complement (A') symbols.
The skill to complete Venn diagrams and calculate the probability of various events—including unions, intersections, and complements—enables pupils to solve complex problems involving overlapping categories and conditional probabilities. These diagrams are particularly useful for organising information in surveys, medical studies, and logical reasoning problems.
Learners must master conditional probability using P(A|B) = P(A ∩ B) / P(B), where the denominator changes to use subset totals rather than universal set totals, and handle three-set diagrams with seven distinct regions involving complex intersections like A ∩ B ∩ C.
Advanced applications include algebraic approaches for incomplete information, set builder notation such as {x : x > 5}, and real-world applications combining percentage-based analysis with multi-step reasoning that integrates several probability concepts simultaneously.
03
Averages
Averages develop essential data analysis skills for interpreting and summarising numerical information across various formats, forming a comprehensive foundation for statistical literacy.
Finding the mean, median, mode and range from sets of data provides fundamental statistical measures for comparing datasets and understanding central tendencies.
Working with data from stem and leaf diagrams, ungrouped data tables, and grouped data tables builds versatility in handling information presented in different formats, including complex grouped frequency tables with unequal class intervals and modal class identification where exact modes cannot be determined.
Advanced Higher tier skills include calculating quartiles, interquartile range, as measures of spread, and detecting outliers.
Mastery of these techniques enables pupils to analyse real-world data from surveys, experiments, and research studies effectively, whilst developing critical skills in justifying choice of appropriate averages, interpreting skewness in data distributions, and making statistical inferences about populations from sample data.
04
Cumulative Frequency & Box Plot
Cumulative frequency and box plots provide sophisticated methods for analysing large datasets and comparing distributions.
The ability to plot a cumulative frequency graph from a table enables visualisation of how data accumulates across different values, revealing patterns in distribution through distinctive S-shaped curves plotted using upper class boundaries.
Learning to create a box plot from a table and from a cumulative frequency diagram develops skills in identifying quartiles, medians, and outliers efficiently using the five-number summary (minimum, Q₁, median, Q₃, maximum) and reading statistical measures at n/4, n/2, and 3n/4 positions.
The capability to compare averages and data using these graphical methods empowers pupils to make informed conclusions about different populations and datasets through structured two-pair comparisons of medians and spreads with contextual interpretation.
Advanced Higher tier skills include outlier detection using the 1.5 × IQR rule, creating modified box plots with outliers marked separately, and analysing skewness by comparing median positions relative to quartiles.
05
Histogram
Histograms represent continuous data through specialised bar charts that reveal distribution patterns and enable detailed statistical analysis.
Comparing histograms and bar charts clarifies the distinction between continuous and discrete data representation, ensuring appropriate graph selection for different data types, with histograms featuring no gaps between bars and using area rather than height to represent frequency.
Understanding frequency density is crucial for interpreting histograms correctly, as it accounts for varying class widths in grouped data using the formula Frequency Density = Frequency ÷ Class Width, where the area of each bar equals the actual frequency.
The skills to plot histograms and find the median and quartiles from a histogram enable pupils to extract key statistical information directly from graphical representations, using linear interpolation within class intervals to locate median at n/2 position and quartiles at n/4 and 3n/4 positions.
Advanced applications include estimating mean from histograms using midpoint calculations, handling unequal class intervals which appear in most examination questions, and multi-step statistical reasoning that combines histogram interpretation with other analytical techniques.
Telephone: +44 07466 980 795
E-mail: info@focusmathstutors.co.uk